The Coronavirus outbreak should be taken for what it is, an outbreak that deserves our attention and precautionary measures, but not panic.
Notes:
- Most important: stay safe, exercise the precautions being given by your government, maintain social distancing, help your neighbors, pray, etc.
- Don’t panic or panic buy
- Avoid any news source or person who uses words like “apocalyptic”
- The information in this page will focus mainly on comparisons to the United States
A web search similar to “[your country] coronavirus trajectory” will reveal news articles and charts that make it seem the world is coming to an end. Here is an example chart used by many news outlets showing total number of infections and deaths, over time, since day zero (100 total infections).0481216202428323640444852566020000020000040000040000060000060000080000080000010000001000000ChinaChinaItalyItalyTurkeyTurkeyUKUKUSAUSASpainSpainSouth KoreaSouth KoreaDay N since 100 total infectionsTotal infections
| Day-N | China | Italy | Turkey | UK | USA | Spain | South Korea |
|---|---|---|---|---|---|---|---|
| 0 | 216 | 132 | 98 | 115 | 103 | 114 | 80 |
| 1 | 235 | 229 | 191 | 163 | 125 | 151 | 155 |
| 2 | 386 | 322 | 359 | 206 | 159 | 200 | 345 |
| 3 | 526 | 400 | 670 | 273 | 233 | 261 | 601 |
| 4 | 623 | 650 | 947 | 321 | 338 | 374 | 762 |
| 5 | 882 | 888 | 1,236 | 373 | 433 | 430 | 892 |
| 6 | 1,323 | 1,128 | 1,529 | 456 | 554 | 589 | 1,146 |
| 7 | 1,988 | 1,689 | 1,872 | 590 | 754 | 1,204 | 1,595 |
| 8 | 2,775 | 1,835 | 2,433 | 707 | 1,025 | 1,639 | 2,022 |
| 9 | 4,528 | 2,502 | 3,629 | 1,140 | 1,312 | 2,140 | 2,931 |
| 10 | 5,994 | 3,089 | 5,698 | 1,391 | 1,663 | 3,004 | 3,526 |
| 11 | 7,734 | 3,858 | 7,402 | 1,543 | 2,174 | 4,231 | 4,212 |
| 12 | 9,714 | 4,636 | 9,217 | 1,950 | 2,951 | 5,753 | 4,812 |
| 13 | 11,809 | 5,883 | 10,827 | 2,630 | 3,774 | 7,753 | 5,328 |
| 14 | 14,399 | 7,375 | 13,531 | 3,277 | 4,661 | 9,191 | 5,766 |
| 15 | 17,211 | 9,172 | 15,679 | 3,983 | 6,427 | 11,178 | 6,284 |
| 16 | 20,448 | 10,149 | 18,135 | 5,018 | 9,415 | 13,716 | 6,767 |
| 17 | 24,320 | 12,462 | 20,921 | 5,683 | 14,250 | 17,147 | 7,134 |
| 18 | 28,047 | 15,113 | 23,934 | 6,650 | 19,624 | 19,980 | 7,382 |
| 19 | 31,207 | 17,660 | 27,069 | 8,077 | 26,747 | 24,926 | 7,513 |
| 20 | 34,625 | 17,750 | 30,217 | 9,529 | 35,206 | 28,572 | 7,755 |
| 21 | 37,232 | 23,980 | 34,109 | 11,658 | 46,442 | 33,089 | 7,869 |
| 22 | 40,206 | 27,980 | 38,226 | 14,543 | 55,231 | 39,673 | 7,979 |
| 23 | 42,696 | 31,506 | 42,282 | 17,089 | 69,194 | 47,610 | 8,086 |
| 24 | 44,724 | 35,713 | 47,029 | 19,522 | 85,991 | 56,188 | 8,162 |
| 25 | 59,865 | 41,035 | 52,167 | 22,141 | 104,686 | 64,059 | 8,236 |
| 26 | 64,021 | 47,021 | 56,956 | 25,150 | 124,665 | 72,248 | 8,320 |
| 27 | 66,559 | 53,578 | 61,049 | 29,474 | 143,025 | 78,797 | 8,413 |
| 28 | 68,566 | 59,138 | 65,111 | 33,718 | 164,620 | 85,195 | 8,565 |
| 29 | 70,618 | 63,936 | 69,392 | 38,168 | 189,618 | 94,417 | 8,652 |
| 30 | 72,508 | 69,185 | 74,193 | 41,903 | 216,721 | 102,136 | 8,799 |
| 31 | 74,258 | 74,395 | 78,546 | 47,806 | 245,540 | 110,238 | 8,897 |
| 32 | 74,652 | 80,548 | 82,329 | 51,608 | 277,965 | 117,710 | 8,961 |
| 33 | 75,543 | 86,507 | 86,306 | 55,242 | 312,237 | 124,736 | 9,037 |
| 34 | 76,369 | 92,481 | 90,980 | 60,733 | 337,635 | 130,759 | 9,137 |
| 35 | 77,016 | 97,698 | 95,591 | 65,077 | 368,196 | 135,032 | 9,241 |
| 36 | 77,234 | 101,748 | 98,674 | 70,272 | 398,809 | 140,510 | 9,332 |
| 37 | 77,749 | 105,801 | 101,790 | 78,991 | 432,132 | 146,690 | 9,478 |
| 38 | 78,159 | 110,583 | 104,912 | 84,279 | 466,033 | 152,446 | 9,583 |
| 39 | 78,598 | 115,251 | 107,773 | 88,621 | 501,560 | 157,022 | 9,661 |
| 40 | 78,927 | 119,836 | 110,130 | 93,873 | 529,951 | 161,852 | 9,786 |
| 41 | 79,355 | 124,641 | 112,261 | 98,476 | 557,571 | 166,019 | 9,881 |
| 42 | 79,929 | 128,957 | 114,653 | 103,093 | 582,594 | 169,496 | 10,071 |
| 43 | 80,134 | 132,556 | 117,589 | 108,692 | 609,516 | 177,464 | 10,157 |
| 44 | 80,261 | 135,595 | 120,204 | 114,217 | 639,664 | 181,504 | 10,251 |
| 45 | 80,380 | 139,431 | 120,067 | 671,331 | 185,904 | 10,332 | |
| 46 | 80,497 | 143,635 | 124,743 | 702,164 | 190,008 | 10,379 | |
| 47 | 80,667 | 147,586 | 129,044 | 735,086 | 192,730 | 10,426 | |
| 48 | 80,768 | 152,280 | 133,495 | 759,687 | 195,315 | 10,479 | |
| 49 | 80,814 | 156,372 | 138,078 | 787,752 | 198,667 | 10,518 | |
| 50 | 80,859 | 159,525 | 143,464 | 825,041 | 201,294 | 10,557 | |
| 51 | 80,879 | 162,497 | 148,377 | 842,629 | 204,346 | 10,584 | |
| 52 | 80,908 | 165,164 | 152,840 | 869,172 | 207,113 | 10,646 | |
| 53 | 80,932 | 168,950 | 157,149 | 890,524 | 210,057 | 10,671 | |
| 54 | 80,954 | 172,443 | 161,145 | 939,053 | 211,786 | 10,698 | |
| 55 | 80,973 | 175,934 | 165,221 | 965,910 | 213,617 | 10,725 | |
| 56 | 80,995 | 178,981 | 171,253 | 988,451 | 214,925 | 10,747 | |
| 57 | 81,020 | 181,237 | 1,012,583 | 217,069 | 10,769 | ||
| 58 | 81,063 | 183,966 | 1,039,909 | 217,587 | 10,787 | ||
| 59 | 81,086 | 187,336 | 1,069,826 | 10,795 | |||
| 60 | 81,130 | 189,982 | 10,808 | ||||
| 61 | 81,229 | 193,003 | 10,817 | ||||
| 62 | 81,281 | 10,828 |
Chart by Visualizer
04812162024283236404448525660100001000020000200003000030000400004000050000500006000060000ChinaChinaItalyItalyTurkeyTurkeyUKUKUSAUSASpainSpainSouth KoreaSouth KoreaDay N since 100 total infectionsTotal deaths
| Day-N | China | Italy | Turkey | UK | USA | Spain | South Korea |
|---|---|---|---|---|---|---|---|
| 0 | 1 | 0 | 0 | 1 | 4 | 0 | 0 |
| 1 | 1 | 4 | 1 | 1 | 7 | 0 | 1 |
| 2 | 4 | 9 | 4 | 2 | 9 | 1 | 2 |
| 3 | 15 | 10 | 9 | 3 | 10 | 3 | 5 |
| 4 | 15 | 15 | 21 | 5 | 12 | 5 | 7 |
| 5 | 24 | 19 | 30 | 6 | 15 | 8 | |
| 6 | 39 | 27 | 37 | 6 | 19 | 5 | 11 |
| 7 | 54 | 33 | 44 | 10 | 24 | 28 | 12 |
| 8 | 79 | 50 | 59 | 10 | 26 | 35 | 13 |
| 9 | 104 | 78 | 75 | 21 | 28 | 47 | 16 |
| 10 | 130 | 105 | 92 | 35 | 38 | 84 | 17 |
| 11 | 168 | 146 | 108 | 55 | 45 | 121 | 22 |
| 12 | 211 | 195 | 131 | 60 | 55 | 136 | 28 |
| 13 | 257 | 231 | 168 | 103 | 67 | 288 | 32 |
| 14 | 302 | 364 | 214 | 144 | 83 | 309 | 35 |
| 15 | 359 | 462 | 277 | 177 | 106 | 491 | 42 |
| 16 | 424 | 629 | 356 | 233 | 148 | 598 | 44 |
| 17 | 490 | 825 | 425 | 281 | 148 | 767 | 50 |
| 18 | 562 | 1,014 | 501 | 335 | 258 | 1,002 | 51 |
| 19 | 635 | 1,266 | 574 | 422 | 338 | 1,326 | 54 |
| 20 | 721 | 1,439 | 649 | 463 | 469 | 1,720 | 60 |
| 21 | 810 | 1,809 | 725 | 578 | 588 | 2,182 | 66 |
| 22 | 907 | 2,156 | 812 | 759 | 799 | 2,696 | 67 |
| 23 | 1,015 | 2,503 | 908 | 1,019 | 1,048 | 3,434 | 72 |
| 24 | 1,112 | 2,976 | 1,006 | 1,228 | 1,294 | 4,089 | 75 |
| 25 | 1,366 | 3,405 | 1,101 | 1,408 | 1,705 | 4,858 | 75 |
| 26 | 1,379 | 4,030 | 1,198 | 1,789 | 2,189 | 5,690 | 81 |
| 27 | 1,522 | 4,825 | 1,296 | 2,532 | 2,507 | 6,528 | 86 |
| 28 | 1,664 | 5,474 | 1,403 | 2,921 | 3,168 | 7,340 | 91 |
| 29 | 1,769 | 6,075 | 1,518 | 3,605 | 4,077 | 8,189 | 100 |
| 30 | 1,867 | 6,818 | 1,643 | 4,313 | 5,136 | 9,053 | 103 |
| 31 | 2,006 | 7,503 | 1,769 | 4,934 | 6,051 | 10,003 | 104 |
| 32 | 2,118 | 8,163 | 1,890 | 5,373 | 7,155 | 10,935 | 113 |
| 33 | 2,236 | 9,134 | 2,017 | 6,159 | 8,499 | 11,744 | 120 |
| 34 | 2,345 | 10,021 | 2,140 | 7,097 | 9,645 | 12,418 | 126 |
| 35 | 2,443 | 10,779 | 2,259 | 7,978 | 10,987 | 13,055 | 131 |
| 36 | 2,593 | 11,589 | 2,376 | 8,958 | 12,893 | 13,798 | 139 |
| 37 | 2,663 | 12,428 | 2,491 | 9,875 | 14,815 | 14,555 | 144 |
| 38 | 2,715 | 13,155 | 2,600 | 10,612 | 16,688 | 15,238 | 152 |
| 39 | 2,744 | 13,915 | 2,706 | 11,329 | 18,775 | 15,843 | 158 |
| 40 | 2,788 | 14,679 | 2,805 | 12,107 | 20,606 | 16,353 | 163 |
| 41 | 2,835 | 15,360 | 2,900 | 12,868 | 22,106 | 16,972 | 168 |
| 42 | 2,870 | 15,887 | 2,992 | 13,729 | 23,647 | 17,489 | 174 |
| 43 | 2,912 | 16,523 | 3,081 | 14,576 | 26,055 | 18,276 | 179 |
| 44 | 2,944 | 17,127 | 3,174 | 15,464 | 30,983 | 18,893 | 182 |
| 45 | 2,981 | 17,667 | 16,060 | 33,282 | 19,478 | 188 | |
| 46 | 3,012 | 18,279 | 16,509 | 37,052 | 20,043 | 191 | |
| 47 | 3,042 | 18,849 | 17,337 | 38,908 | 20,453 | 197 | |
| 48 | 3,070 | 19,468 | 18,100 | 40,680 | 20,852 | 205 | |
| 49 | 3,097 | 19,899 | 18,738 | 42,537 | 21,282 | 209 | |
| 50 | 3,120 | 20,463 | 19,743 | 45,061 | 21,717 | 213 | |
| 51 | 3,137 | 21,067 | 20,586 | 46,782 | 22,157 | 217 | |
| 52 | 3,159 | 21,645 | 21,006 | 49,961 | 22,524 | 223 | |
| 53 | 3,170 | 22,170 | 21,344 | 51,015 | 22,902 | 226 | |
| 54 | 3,177 | 22,745 | 22,253 | 53,187 | 23,190 | 231 | |
| 55 | 3,192 | 23,225 | 23,048 | 54,874 | 23,191 | 234 | |
| 56 | 3,201 | 23,658 | 23,722 | 56,243 | 23,192 | 238 | |
| 57 | 3,214 | 24,112 | 58,353 | 23,645 | 239 | ||
| 58 | 3,223 | 24,646 | 60,964 | 23,913 | 241 | ||
| 59 | 3,239 | 25,083 | 63,004 | 243 | |||
| 60 | 3,247 | 25,547 | 245 | ||||
| 61 | 3,251 | 25,967 | 246 | ||||
| 62 | 3,257 | 247 |
Chart by Visualizer
Raw data source: https://www.ecdc.europa.eu/en/publications-data/download-todays-data-geographic-distribution-covid-19-cases-worldwide
Along with a chart like this, the headline and article will use a words like “apocalyptic” and phrases like “X is going to get all of us killed”.
Let’s look at a chart showing the same data, but displayed as a percentage of infections and deaths, as opposed to total infections and deaths, in those countries.04812162024283236404448525660.10%.10%.20%.20%.30%.30%.40%.40%ChinaChinaItalyItalyTurkeyTurkeyUKUKUSAUSASpainSpainSouth KoreaSouth KoreaDay N since 100 total infections% of population - infected
| Day-N | China | Italy | Turkey | UK | USA | Spain | South Korea |
|---|---|---|---|---|---|---|---|
| 0 | 0 | 0 | 0 | 0 | 0 | 0 | 0 |
| 1 | 0 | 0 | 0 | 0 | 0 | 0 | 0 |
| 2 | 0 | 0 | 0 | 0 | 0 | 0 | 0 |
| 3 | 0 | 0 | 0 | 0 | 0 | 0 | 0 |
| 4 | 0 | 0 | 0 | 0 | 0 | 0 | 0 |
| 5 | 0 | 0 | 0 | 0 | 0 | 0 | 0 |
| 6 | 0 | 0 | 0 | 0 | 0 | 0 | 0 |
| 7 | 0 | 0 | 0 | 0 | 0 | 0 | 0 |
| 8 | 0 | 0 | 0 | 0 | 0 | 0 | 0 |
| 9 | 0 | 0 | 0 | 0 | 0 | 0 | 0 |
| 10 | 0 | 0 | 0 | 0 | 0 | 0 | 0 |
| 11 | 0 | 0 | 0 | 0 | 0 | 0 | 0 |
| 12 | 0 | 0 | 0 | 0 | 0 | 0 | 0 |
| 13 | 0 | 0 | 0 | 0 | 0 | 0 | 0 |
| 14 | 0 | 0 | 0 | 0 | 0 | 0 | 0 |
| 15 | 0 | 0 | 0 | 0 | 0 | 0 | 0 |
| 16 | 0 | 0 | 0 | 0 | 0 | 0 | 0 |
| 17 | 0 | 0 | 0 | 0 | 0 | 0 | 0 |
| 18 | 0 | 0 | 0 | 0 | 0 | 0 | 0 |
| 19 | 0 | 0 | 0 | 0 | 0 | 0.001 | 0 |
| 20 | 0 | 0 | 0 | 0 | 0 | 0.001 | 0 |
| 21 | 0 | 0 | 0 | 0 | 0 | 0.001 | 0 |
| 22 | 0 | 0 | 0 | 0 | 0 | 0.001 | 0 |
| 23 | 0 | 0.001 | 0.001 | 0 | 0 | 0.001 | 0 |
| 24 | 0 | 0.001 | 0.001 | 0 | 0 | 0.001 | 0 |
| 25 | 0 | 0.001 | 0.001 | 0 | 0 | 0.001 | 0 |
| 26 | 0 | 0.001 | 0.001 | 0 | 0 | 0.002 | 0 |
| 27 | 0 | 0.001 | 0.001 | 0 | 0 | 0.002 | 0 |
| 28 | 0 | 0.001 | 0.001 | 0.001 | 0.001 | 0.002 | 0 |
| 29 | 0 | 0.001 | 0.001 | 0.001 | 0.001 | 0.002 | 0 |
| 30 | 0 | 0.001 | 0.001 | 0.001 | 0.001 | 0.002 | 0 |
| 31 | 0 | 0.001 | 0.001 | 0.001 | 0.001 | 0.002 | 0 |
| 32 | 0 | 0.001 | 0.001 | 0.001 | 0.001 | 0.003 | 0 |
| 33 | 0 | 0.001 | 0.001 | 0.001 | 0.001 | 0.003 | 0 |
| 34 | 0 | 0.002 | 0.001 | 0.001 | 0.001 | 0.003 | 0 |
| 35 | 0 | 0.002 | 0.001 | 0.001 | 0.001 | 0.003 | 0 |
| 36 | 0 | 0.002 | 0.001 | 0.001 | 0.001 | 0.003 | 0 |
| 37 | 0 | 0.002 | 0.001 | 0.001 | 0.001 | 0.003 | 0 |
| 38 | 0 | 0.002 | 0.001 | 0.001 | 0.001 | 0.003 | 0 |
| 39 | 0 | 0.002 | 0.001 | 0.001 | 0.002 | 0.003 | 0 |
| 40 | 0 | 0.002 | 0.001 | 0.001 | 0.002 | 0.003 | 0 |
| 41 | 0 | 0.002 | 0.001 | 0.001 | 0.002 | 0.004 | 0 |
| 42 | 0 | 0.002 | 0.001 | 0.002 | 0.002 | 0.004 | 0 |
| 43 | 0 | 0.002 | 0.001 | 0.002 | 0.002 | 0.004 | 0 |
| 44 | 0 | 0.002 | 0.001 | 0.002 | 0.002 | 0.004 | 0 |
| 45 | 0 | 0.002 | 0.002 | 0.002 | 0.004 | 0 | |
| 46 | 0 | 0.002 | 0.002 | 0.002 | 0.004 | 0 | |
| 47 | 0 | 0.002 | 0.002 | 0.002 | 0.004 | 0 | |
| 48 | 0 | 0.003 | 0.002 | 0.002 | 0.004 | 0 | |
| 49 | 0 | 0.003 | 0.002 | 0.002 | 0.004 | 0 | |
| 50 | 0 | 0.003 | 0.002 | 0.003 | 0.004 | 0 | |
| 51 | 0 | 0.003 | 0.002 | 0.003 | 0.004 | 0 | |
| 52 | 0 | 0.003 | 0.002 | 0.003 | 0.004 | 0 | |
| 53 | 0 | 0.003 | 0.002 | 0.003 | 0.005 | 0 | |
| 54 | 0 | 0.003 | 0.002 | 0.003 | 0.005 | 0 | |
| 55 | 0 | 0.003 | 0.002 | 0.003 | 0.005 | 0 | |
| 56 | 0 | 0.003 | 0.003 | 0.003 | 0.005 | 0 | |
| 57 | 0 | 0.003 | 0.003 | 0.005 | 0 | ||
| 58 | 0 | 0.003 | 0.003 | 0.005 | 0 | ||
| 59 | 0 | 0.003 | 0.003 | 0 | |||
| 60 | 0 | 0.003 | 0 | ||||
| 61 | 0 | 0.003 | 0 | ||||
| 62 | 0 | 0 |
Chart by Visualizer
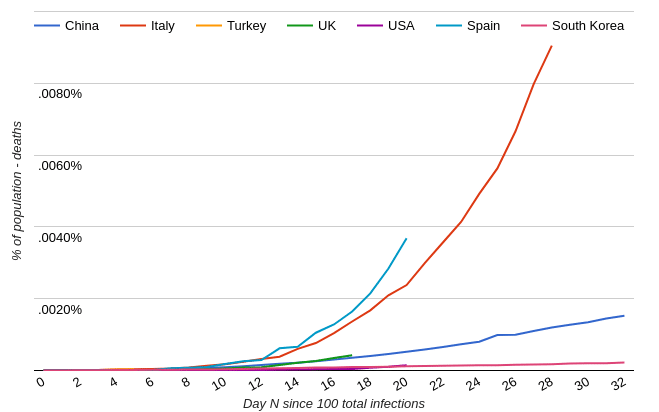
04812162024283236404448525660.0100%.0100%.0200%.0200%.0300%.0300%.0400%.0400%.0500%.0500%ChinaChinaItalyItalyTurkeyTurkeyUKUKUSAUSASpainSpainSouth KoreaSouth KoreaDay N since 100 total infections% of population - deaths
| Day-N | China | Italy | Turkey | UK | USA | Spain | South Korea |
|---|---|---|---|---|---|---|---|
| 0 | 0 | 0 | 0 | 0 | 0 | 0 | 0 |
| 1 | 0 | 0 | 0 | 0 | 0 | 0 | 0 |
| 2 | 0 | 0 | 0 | 0 | 0 | 0 | 0 |
| 3 | 0 | 0 | 0 | 0 | 0 | 0 | 0 |
| 4 | 0 | 0 | 0 | 0 | 0 | 0 | 0 |
| 5 | 0 | 0 | 0 | 0 | 0 | 0 | 0 |
| 6 | 0 | 0 | 0 | 0 | 0 | 0 | 0 |
| 7 | 0 | 0 | 0 | 0 | 0 | 0 | 0 |
| 8 | 0 | 0 | 0 | 0 | 0 | 0 | 0 |
| 9 | 0 | 0 | 0 | 0 | 0 | 0 | 0 |
| 10 | 0 | 0 | 0 | 0 | 0 | 0 | 0 |
| 11 | 0 | 0 | 0 | 0 | 0 | 0 | 0 |
| 12 | 0 | 0 | 0 | 0 | 0 | 0 | 0 |
| 13 | 0 | 0 | 0 | 0 | 0 | 0 | 0 |
| 14 | 0 | 0 | 0 | 0 | 0 | 0 | 0 |
| 15 | 0 | 0 | 0 | 0 | 0 | 0 | 0 |
| 16 | 0 | 0 | 0 | 0 | 0 | 0 | 0 |
| 17 | 0 | 0 | 0 | 0 | 0 | 0 | 0 |
| 18 | 0 | 0 | 0 | 0 | 0 | 0 | 0 |
| 19 | 0 | 0 | 0 | 0 | 0 | 0 | 0 |
| 20 | 0 | 0 | 0 | 0 | 0 | 0 | 0 |
| 21 | 0 | 0 | 0 | 0 | 0 | 0 | 0 |
| 22 | 0 | 0 | 0 | 0 | 0 | 0 | 0 |
| 23 | 0 | 0 | 0 | 0 | 0 | 0 | 0 |
| 24 | 0 | 0 | 0 | 0 | 0 | 0 | 0 |
| 25 | 0 | 0 | 0 | 0 | 0 | 0 | 0 |
| 26 | 0 | 0 | 0 | 0 | 0 | 0 | 0 |
| 27 | 0 | 0 | 0 | 0 | 0 | 0 | 0 |
| 28 | 0 | 0 | 0 | 0 | 0 | 0 | 0 |
| 29 | 0 | 0 | 0 | 0 | 0 | 0 | 0 |
| 30 | 0 | 0 | 0 | 0 | 0 | 0 | 0 |
| 31 | 0 | 0 | 0 | 0 | 0 | 0 | 0 |
| 32 | 0 | 0 | 0 | 0 | 0 | 0 | 0 |
| 33 | 0 | 0 | 0 | 0 | 0 | 0 | 0 |
| 34 | 0 | 0 | 0 | 0 | 0 | 0 | 0 |
| 35 | 0 | 0 | 0 | 0 | 0 | 0 | 0 |
| 36 | 0 | 0 | 0 | 0 | 0 | 0 | 0 |
| 37 | 0 | 0 | 0 | 0 | 0 | 0 | 0 |
| 38 | 0 | 0 | 0 | 0 | 0 | 0 | 0 |
| 39 | 0 | 0 | 0 | 0 | 0 | 0 | 0 |
| 40 | 0 | 0 | 0 | 0 | 0 | 0 | 0 |
| 41 | 0 | 0 | 0 | 0 | 0 | 0 | 0 |
| 42 | 0 | 0 | 0 | 0 | 0 | 0 | 0 |
| 43 | 0 | 0 | 0 | 0 | 0 | 0 | 0 |
| 44 | 0 | 0 | 0 | 0 | 0 | 0 | 0 |
| 45 | 0 | 0 | 0 | 0 | 0 | 0 | |
| 46 | 0 | 0 | 0 | 0 | 0 | 0 | |
| 47 | 0 | 0 | 0 | 0 | 0 | 0 | |
| 48 | 0 | 0 | 0 | 0 | 0 | 0 | |
| 49 | 0 | 0 | 0 | 0 | 0 | 0 | |
| 50 | 0 | 0 | 0 | 0 | 0 | 0 | |
| 51 | 0 | 0 | 0 | 0 | 0 | 0 | |
| 52 | 0 | 0 | 0 | 0 | 0 | 0 | |
| 53 | 0 | 0 | 0 | 0 | 0 | 0 | |
| 54 | 0 | 0 | 0 | 0 | 0 | 0 | |
| 55 | 0 | 0 | 0 | 0 | 0 | 0 | |
| 56 | 0 | 0 | 0 | 0 | 0 | 0 | |
| 57 | 0 | 0 | 0 | 0.001 | 0 | ||
| 58 | 0 | 0 | 0 | 0.001 | 0 | ||
| 59 | 0 | 0 | 0 | 0 | |||
| 60 | 0 | 0 | 0 | ||||
| 61 | 0 | 0 | 0 | ||||
| 62 | 0 | 0 |
Chart by Visualizer
Raw data source: https://www.ecdc.europa.eu/en/publications-data/download-todays-data-geographic-distribution-covid-19-cases-worldwide
Another interesting view of the data is number of new cases per day (as a percentage of population).04812162024283236404448525660.0025%.0025%.0050%.0050%.0075%.0075%.0100%.0100%.0125%.0125%.0150%.0150%.0175%.0175%ChinaChinaItalyItalyTurkeyTurkeyUKUKUSAUSASpainSpainSouth KoreaSouth KoreaDay N since 100 total infections% of population - newly infected
| Day-N | China | Italy | Turkey | UK | USA | Spain | South Korea |
|---|---|---|---|---|---|---|---|
| 0 | 0 | 0 | 0 | 0 | 0 | 0 | 0 |
| 1 | 0 | 0 | 0 | 0 | 0 | 0 | 0 |
| 2 | 0 | 0 | 0 | 0 | 0 | 0 | 0 |
| 3 | 0 | 0 | 0 | 0 | 0 | 0 | 0 |
| 4 | 0 | 0 | 0 | 0 | 0 | 0 | 0 |
| 5 | 0 | 0 | 0 | 0 | 0 | 0 | 0 |
| 6 | 0 | 0 | 0 | 0 | 0 | 0 | 0 |
| 7 | 0 | 0 | 0 | 0 | 0 | 0 | 0 |
| 8 | 0 | 0 | 0 | 0 | 0 | 0 | 0 |
| 9 | 0 | 0 | 0 | 0 | 0 | 0 | 0 |
| 10 | 0 | 0 | 0 | 0 | 0 | 0 | 0 |
| 11 | 0 | 0 | 0 | 0 | 0 | 0 | 0 |
| 12 | 0 | 0 | 0 | 0 | 0 | 0 | 0 |
| 13 | 0 | 0 | 0 | 0 | 0 | 0 | 0 |
| 14 | 0 | 0 | 0 | 0 | 0 | 0 | 0 |
| 15 | 0 | 0 | 0 | 0 | 0 | 0 | 0 |
| 16 | 0 | 0 | 0 | 0 | 0 | 0 | 0 |
| 17 | 0 | 0 | 0 | 0 | 0 | 0 | 0 |
| 18 | 0 | 0 | 0 | 0 | 0 | 0 | 0 |
| 19 | 0 | 0 | 0 | 0 | 0 | 0 | 0 |
| 20 | 0 | 0 | 0 | 0 | 0 | 0 | 0 |
| 21 | 0 | 0 | 0 | 0 | 0 | 0 | 0 |
| 22 | 0 | 0 | 0 | 0 | 0 | 0 | 0 |
| 23 | 0 | 0 | 0 | 0 | 0 | 0 | 0 |
| 24 | 0 | 0 | 0 | 0 | 0 | 0 | 0 |
| 25 | 0 | 0 | 0 | 0 | 0 | 0 | 0 |
| 26 | 0 | 0 | 0 | 0 | 0 | 0 | 0 |
| 27 | 0 | 0 | 0 | 0 | 0 | 0 | 0 |
| 28 | 0 | 0 | 0 | 0 | 0 | 0 | 0 |
| 29 | 0 | 0 | 0 | 0 | 0 | 0 | 0 |
| 30 | 0 | 0 | 0 | 0 | 0 | 0 | 0 |
| 31 | 0 | 0 | 0 | 0 | 0 | 0 | 0 |
| 32 | 0 | 0 | 0 | 0 | 0 | 0 | 0 |
| 33 | 0 | 0 | 0 | 0 | 0 | 0 | 0 |
| 34 | 0 | 0 | 0 | 0 | 0 | 0 | 0 |
| 35 | 0 | 0 | 0 | 0 | 0 | 0 | 0 |
| 36 | 0 | 0 | 0 | 0 | 0 | 0 | 0 |
| 37 | 0 | 0 | 0 | 0 | 0 | 0 | 0 |
| 38 | 0 | 0 | 0 | 0 | 0 | 0 | 0 |
| 39 | 0 | 0 | 0 | 0 | 0 | 0 | 0 |
| 40 | 0 | 0 | 0 | 0 | 0 | 0 | 0 |
| 41 | 0 | 0 | 0 | 0 | 0 | 0 | 0 |
| 42 | 0 | 0 | 0 | 0 | 0 | 0 | 0 |
| 43 | 0 | 0 | 0 | 0 | 0 | 0 | 0 |
| 44 | 0 | 0 | 0 | 0 | 0 | 0 | 0 |
| 45 | 0 | 0 | 0 | 0 | 0 | 0 | |
| 46 | 0 | 0 | 0 | 0 | 0 | 0 | |
| 47 | 0 | 0 | 0 | 0 | 0 | 0 | |
| 48 | 0 | 0 | 0 | 0 | 0 | 0 | |
| 49 | 0 | 0 | 0 | 0 | 0 | 0 | |
| 50 | 0 | 0 | 0 | 0 | 0 | 0 | |
| 51 | 0 | 0 | 0 | 0 | 0 | 0 | |
| 52 | 0 | 0 | 0 | 0 | 0 | 0 | |
| 53 | 0 | 0 | 0 | 0 | 0 | 0 | |
| 54 | 0 | 0 | 0 | 0 | 0 | 0 | |
| 55 | 0 | 0 | 0 | 0 | 0 | 0 | |
| 56 | 0 | 0 | 0 | 0 | 0 | 0 | |
| 57 | 0 | 0 | 0 | 0 | 0 | ||
| 58 | 0 | 0 | 0 | 0 | 0 | ||
| 59 | 0 | 0 | 0 | 0 | |||
| 60 | 0 | 0 | 0 | ||||
| 61 | 0 | 0 | 0 | ||||
| 62 | 0 | 0 | |||||
| 63 | 0 | 0 |
Chart by Visualizer
Updates:
- 2020-03-23: death rate charts posted
- 2020-03-26: Corrected a computation error in the China data
- 2020-04-06: Added the “new cases per day” chart
- Daily chart updates: 2020-03-23 – 2020-04-13
- Chart updates every 3 days: 2020-04-13 – 2020-05-01
- Last update, 01 May 2020, the day Texas reopened. This page will no longer be updated unless there is a significant change.
If you are looking for a reliable and experienced offensive security service that provides Rock Solid Security, look no further than PEN Consultants for all your information and cybersecurity testing needs. Contact us: https://penconsultants.com/contact-us/